Debugging is an important skill for software developers. For those working with Ruby on Rails, there are several techniques that can help you spot and fix bugs. In this article, I'll share some practical methods I've used and still use.
1. Displaying Data in Views
As a beginner in Ruby on Rails, I found it useful to display data right in the views. This helped me a lot when dealing with if statements. To understand a problem, I would show the values used in the if statement. This approach made it clear what was happening with the variables, helping me solve the issue.
Example for your index.html.erb file:
<% @users.each do |user| %>
  <p>
    User: <%= user.name %>
    <% if user.age >= 18 %>
      is an Adult
    <% else %>
      isn't an Adult
    <% end %>

    <%# Show user details and the 'if' statement for debugging %>
    Debug Info: <%= user.inspect %>, Adult? = <%= user.age >= 18 %>
  </p>
<% end %>
Here, the debug info shows the user's age and their adult status. This is only for debugging and should be removed for the final version.
2. Using "puts" Statements
puts statements are simple but effective for debugging. They print information to the server console, which is useful for checking what's happening on the server side. For example, to understand a method's behavior, puts can be very enlightening:
In your users_controller.rb:
def show
  # Show params and user details in the console
  puts "Looking at parameters: #{params}"
  @user = User.find(params[:id])
  puts "Checking user: #{@user.inspect}"
end
When you visit a user's page, these statements will show the user's details and parameters in your Rails server console. This confirms you're getting the right user.
Also, always read the messages in the Rails server console. They are detailed and can teach you a lot about what's happening in your application.
3. Using rails console
rails console is a powerful tool for working with your Rails app's models and data via command line. It's perfect for testing code snippets and seeing their effects. You can create a new user, change data, or check database records. Just run rails c or rails console in your terminal, and try commands like user = User.new or User.count.
Bonus tip: You can run the console in sandbox mode, which won't modify your data while you experiment with it. To do this, just run rails console --sandbox.
Read more in Ruby on Rails Guides
4. Debugging with the Pry Gem
Pry gem is a fantastic tool, almost like an enhanced Rails console. You can pause your code with binding.pry in a method in your controller. It's like stopping your code to closely examine variables like user_params. You can even test methods right in the console.
def create
  # Pauses your code for exploration
  binding.pry

  @user = User.new(user_params)

  if @user.save
    redirect_to @user, notice: 'User created.'
  else
    render :new
  end
end
To finish debugging with pry, type quit or exit. It's an excellent way to understand your code deeply.
Read more about https://github.com/pry/pry
Alternative Gems
Apart from pry, gems like byebug and debugger also offer similar debugging features.
5. Using Log Files
Rails automatically creates log files that track activities like requests, database queries, and errors. These logs are crucial, especially in production. You'll find them in the log directory of your Rails app.
development.log: Logs for development.production.log: Logs for production.test.log: Logs for testing.
In bigger projects production logs are often sent to 3rd party services like Datadog.
Viewing Log Files
To see a log file, just open it in a text editor or use command-line tools, like tail -f log/development.log.
Example Log Entry
Started GET "/users/1" for 127.0.0.1 at 2023-11-22 12:34:56 +0000
Processing by UsersController#show as HTML
  Parameters: {"id"=>"1"}
  User Load (0.4ms)  SELECT  "users".* FROM "users" WHERE "users"."id" = $1 LIMIT 1  [["id", 1]]
  Rendered users/show.html.erb within layouts/application (15.6ms)
Completed 200 OK in 46ms (Views: 30.1ms | ActiveRecord: 0.4ms)
This log entry shows a GET request for /users/1, calling the show action in the UsersController and the database query for the user.
6. Debugging with an IDE - VS Code, RubyMine
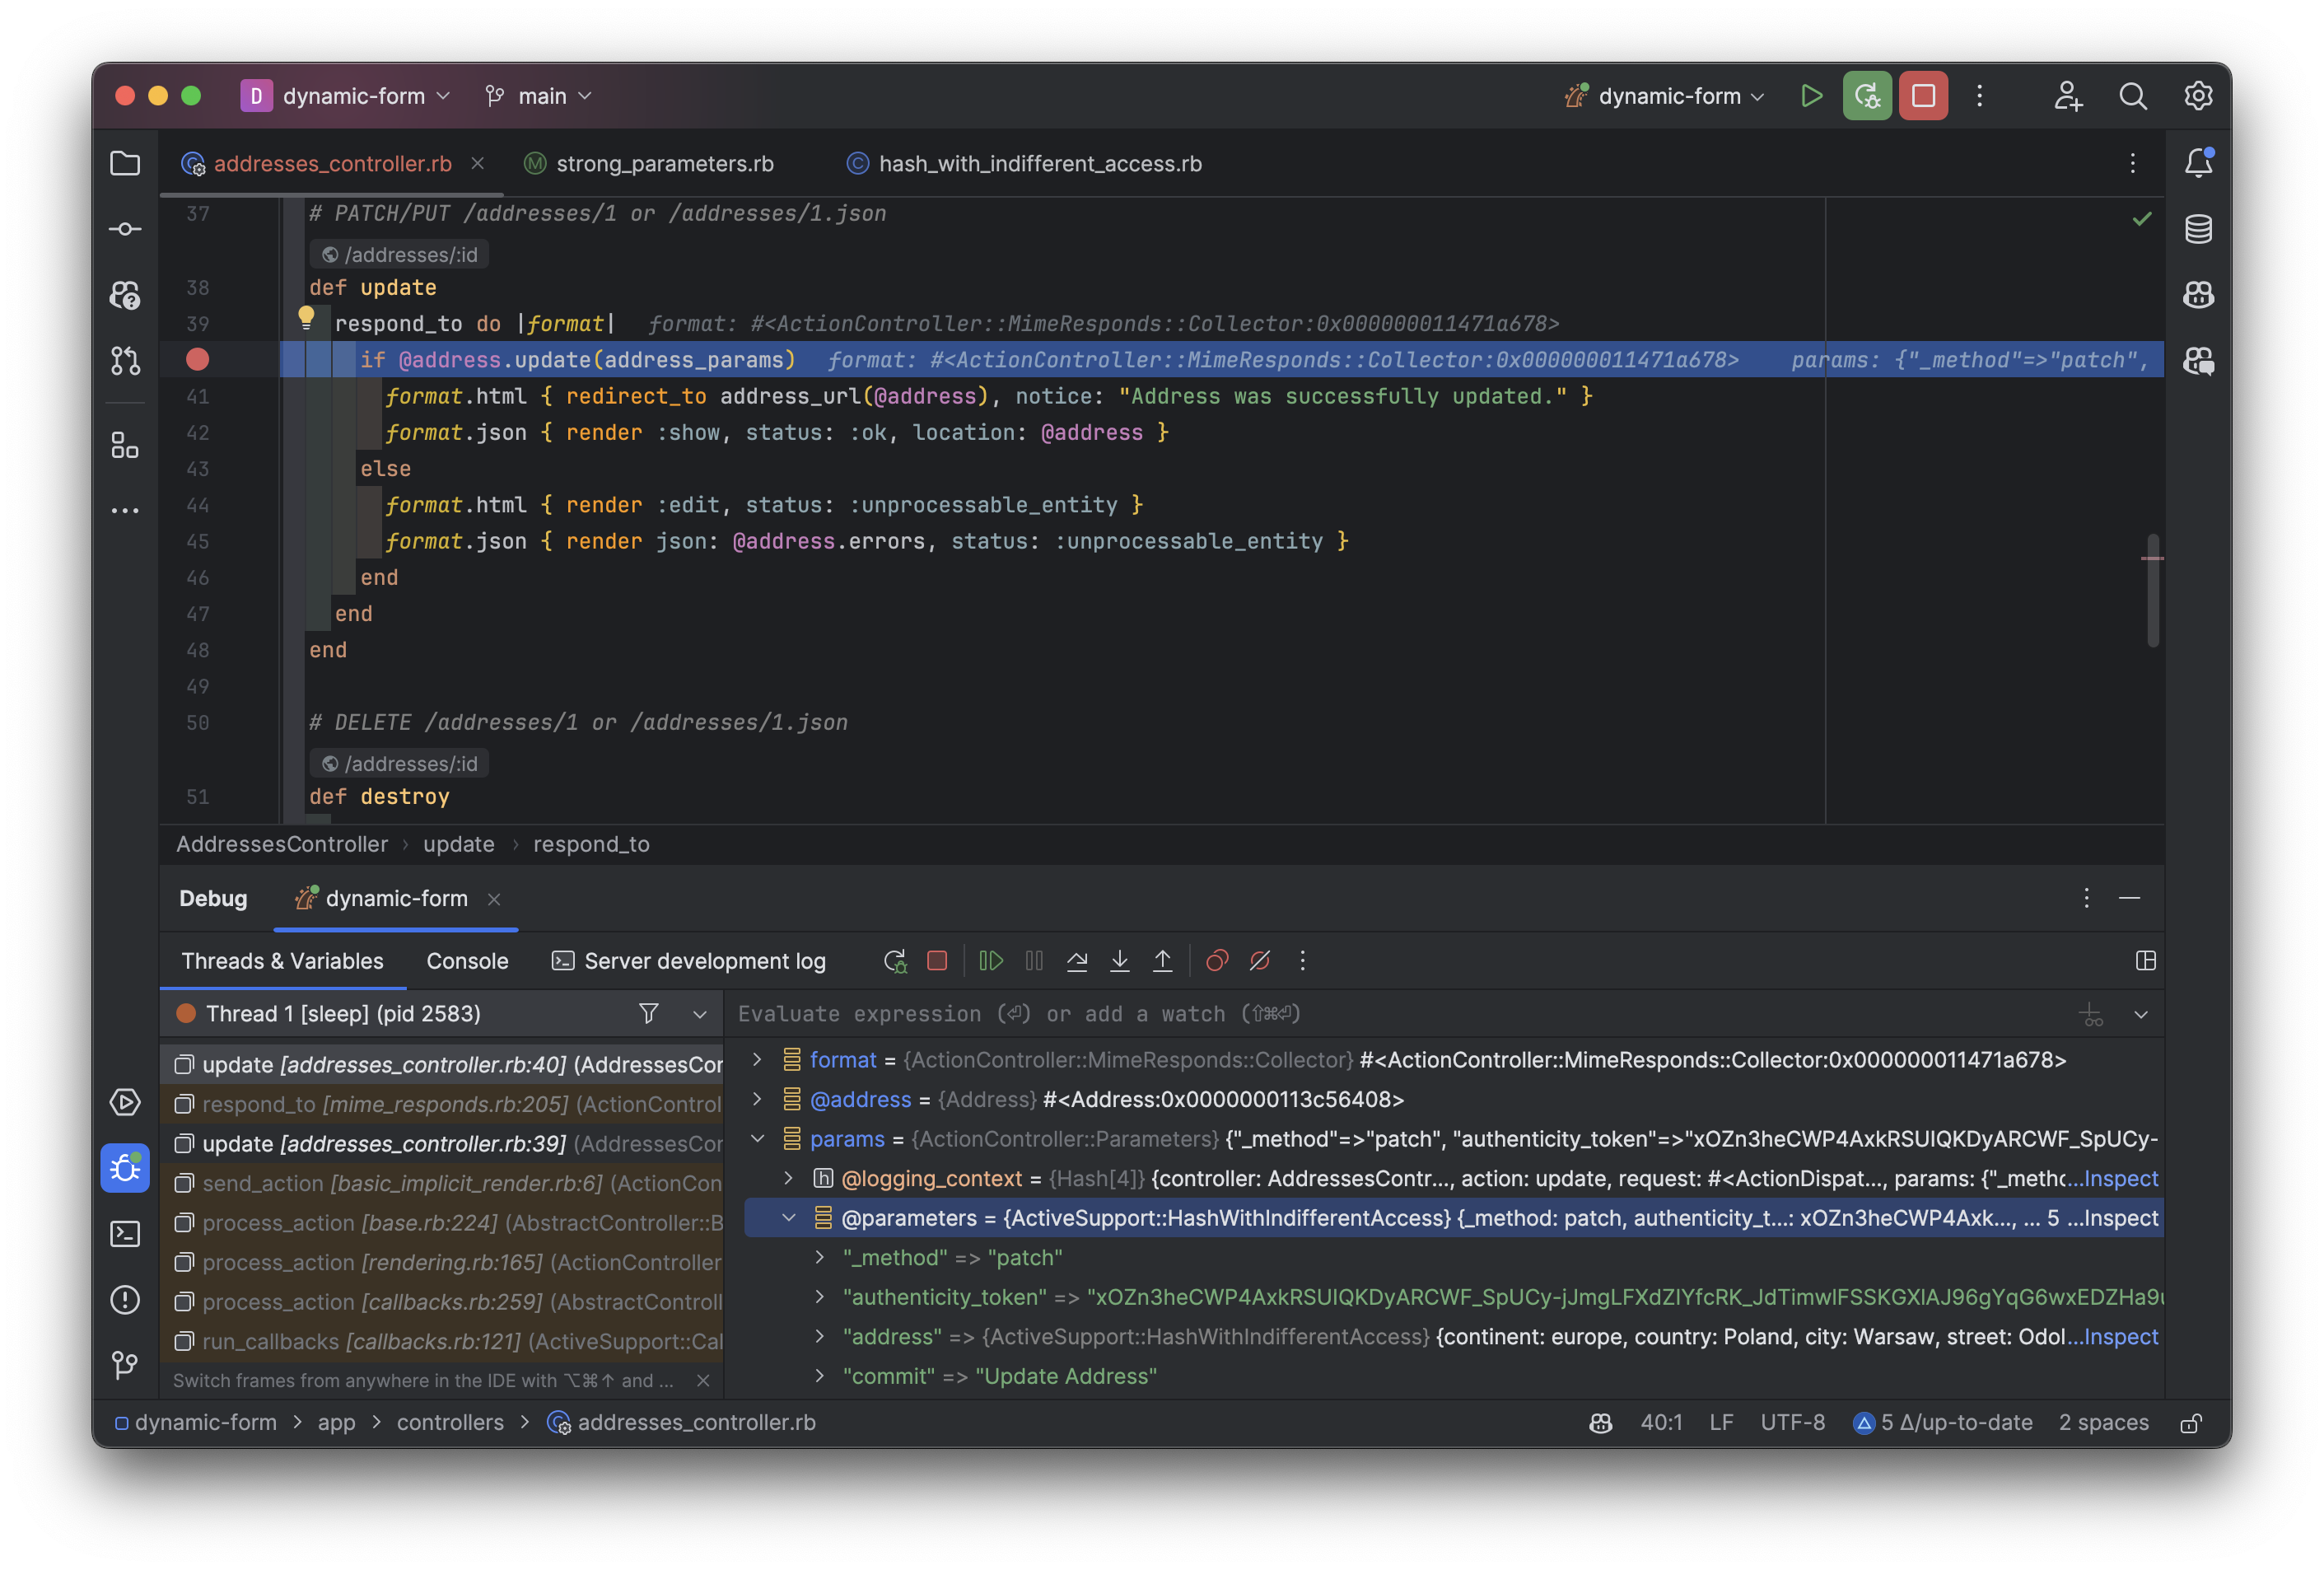
IDEs like VS Code or RubyMine have advanced debugging features. They offer a visual interface for setting breakpoints and inspecting variables. Check your IDE's documentation for more on this.

The screenshot shows a RubyMine IDE during a debugging session for an update method in an AddressesController, with a breakpoint set (red dot left to the code) and variables displayed in the debugging panel below the code.
Conclusion
Debugging in Ruby on Rails improves with practice. Start with simple methods like displaying data in views and using puts statements. Use the rails console and pry gem for deeper investigation. Don't forget log files. If you're using an IDE, use its debugging tools. Each debugging challenge is a chance to grow as a Rails developer. Keep experimenting and learning!


